
Debasement of the United States Dollar, Part II
Corn Moon, 07 September 2025
This month’s post is a continuation of the theme established last month – the debasement of the United States dollar (USD). Herein I discuss the cost of housing in the United States, adjusting for the debasement of the USD.
Last month, I adjusted the value of the USD over time with respect to an equally weighted basket of three commodities: wheat, oil, and gold. An inflection point for the USD’s value occurred in 1971, when the USD was untethered from gold ($35 per ounce at the time). From 1959 to 1971, the USD maintained its value against these three commodities. After 1971, however, it debased about 96.33% each year, corresponding to an inflation rate of 3.81%.
The question to address in this post is: how have the real costs of housing (both ownership and rental) changed over the decades, give this debasement. I obtained the median price of houses (detached units) from the Federal Reserve at:
I obtained average annual rent (primary residence) increases, from which I reconstituted actual average rents, from:
First, we examine the price of house ownership and cost of residence rent in nominal USD, from 1963 to 2024. Both nominal prices are standardized to 100 in 1963.
Figure 1
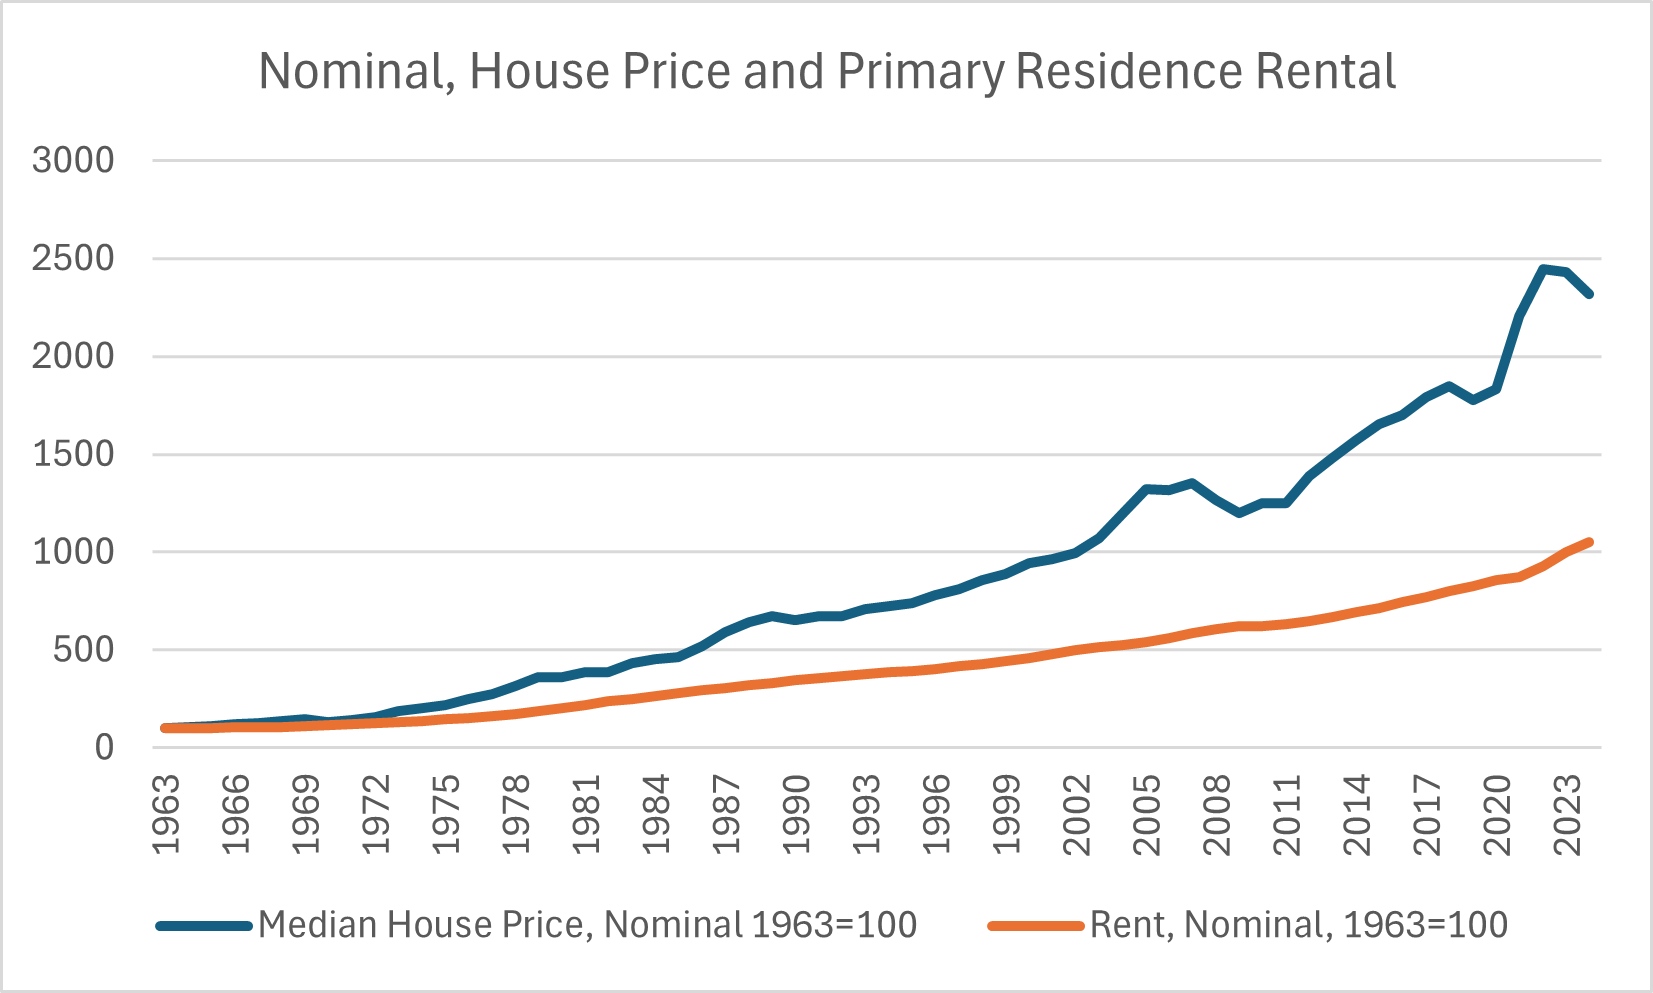
The vertical scale of the above figure obscures the relatively slow increases of house ownership and rental prices over the first decade. Compared to 1963, 1970 house prices had increased 28.5%, 1970 rentals 16%. These correspond to annual rates of 3.6% and 2.1% respectively. After 1971, we see both steeper average annual increases and divergence between ownership and rental. Compared to 1972, 2024 house prices had increased 1388%, rental prices 738%. These correspond to average annual rates of 5.33% and 4.17% respectively.
Adjusting these prices by annual USD debasement paints a completely different picture. Figure 2 shows such scaled prices where both ownership and rental are scaled to 100 in the year 1963.
Figure 2
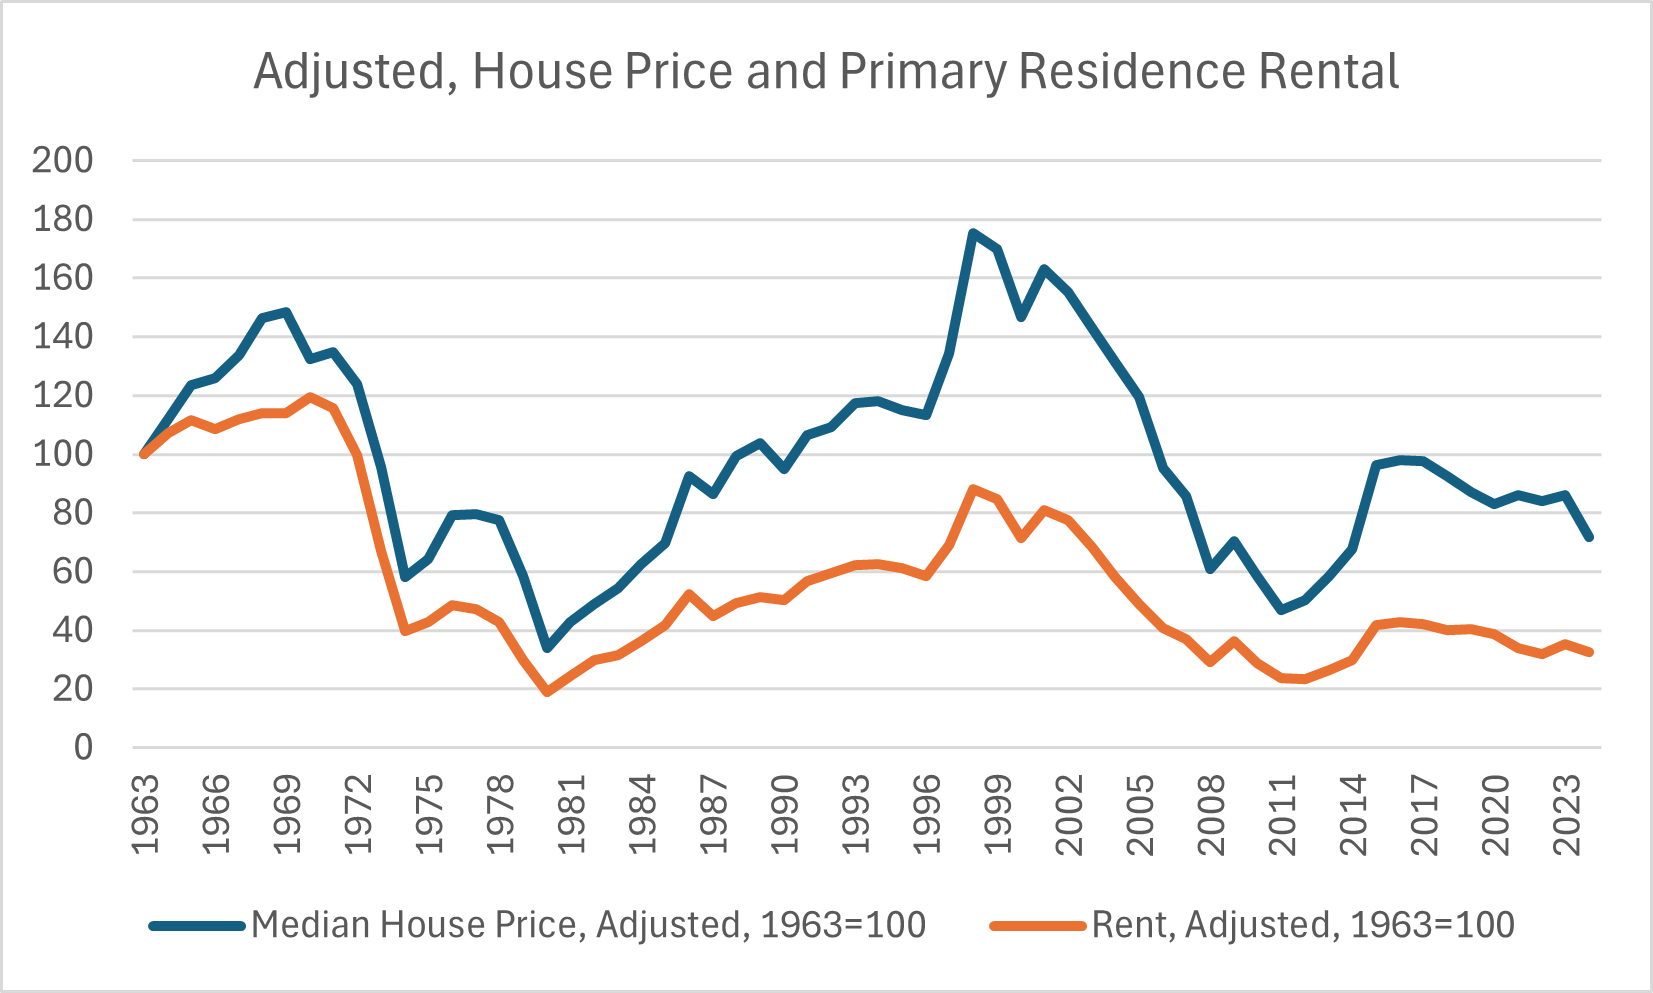
Several trends are evident in the figure above. The first is that real housing prices increased before the 1971 inflection point. The second trend is a steep drop in real housing prices immediately after 1971. Though prices have been erratic over the decades, the net real prices of housing have decreased from 1971 to the present. And finally, we see that both prices move together in synchronicity. House ownership and rental prices rise and fall together.
Some of these trends are intuitively obvious. It makes sense that house ownership and rentals would rise and fall together. If one modality becomes overpriced, people move to the other, and vice versa. The decline in the 1970s makes sense when we consider the successive shocks to the USD: untethered from gold, OPEC oil embargo, rampant inflation (debasement). The incline in the 1980s reflects rising interest rates “strengthening” the USD. Prices peaked just before the 2000 tech bubble crash.
What seems counterintuitive, however, is that net real prices have decreased over the past 50 years. In particular, in adjusted USD, the price of a house in 2024 is only 58% of the price in 1972. This is an approximate annual decrease of 1% annually. In adjusted USD, the cost of rent in 2024 is 33% the cost in 1972. This is an approximate annual decrease of 2.1% annually.
What are we to make of such a trend? It appears that a relatively free market in the United States has steadily increased the supply of housing to meet demand. This trend has been obscured by the debasement of the USD. For all the gloom and doom about housing costs in the United States, the overall trend has been favorable for citizens. There are, no doubt, pockets where price of housing is exceedingly high. Overall, however, the relative cost of housing has decreased across the United States, at least with respect to wheat, oil and gold.
Other statistics confirm this fortunate trend. According to:
In 1960, there was an average of 3.33 people per household, but in 2023, this figure had decreased to 2.51 people per household.
According to:
Since 1960, the number of households more than doubled from 53 million to over 131 million households in 2023.
In concordance with the rise of single-person households, the percentage of family households with own children living in the household has declined since 1970 from 56 percent to 40.26 percent in 2022.
Housing supply, in general, has met increased demand over the past 50 years. There are more households and fewer people per household.
These numbers, however, contradict the proverbial wisdom that owning a house is a good investment financially. The cost of house ownership may be worthwhile when overall lifestyle is considered. But in financial terms alone, it is a poor option. Not only does a house lose value over time, but the house owner incurs annual expenses to maintain said house. Individual cases may differ, but these expenses are approximately 4% of the house’s value each year (2.5% maintenance, 0.9% property tax, 0.7% insurance). And this does not include the interest cost on a mortgage. A 5%, 30-year mortgage will have total interest payments that approximately equal the purchase price of the house. This cost spread out over 30 years is approximately 3.3% to price of the house. A house would have to increase in real value by 7.5% annually to compensate for the above expenses.
We conclude from all of the above that, in the United States, taken as a whole, housing has become more affordable over the past 50 years, despite the debasement of the USD.
|
Previous Post |
Next Post |